Overview
Campaign Reporting is best used when evaluating campaign delivery and performance. Similar to Inventory Reporting, it provides total values for impressions, ad requests, plays, winning bids, spend, and revenue for the selected reporting period, but with the added ability to break this data down by advertiser, deal, DSP, and player. This makes Campaign Reporting the primary tool for validating campaign delivery, budget pacing, and advertiser performance over a defined timeframe.
Use Campaign Reporting to analyze total campaign delivery and spend over a selected period.
Accessing Campaign Reports
You can access Campaign Reporting through the Reporting menu in the application interface.
Configuring Your Report
At the top of the page, the General Information Bar allows you to filter your report using the following criteria:
- Networks: Select specific networks to include in the report.
- Players: Filter by individual players.
- Advertisers: Select the advertisers to include.
- DSPs: Filter by DSPs participating in the campaigns.
- Deals / Adomain / Seats: Optional filters for more granular reporting.
- Time Range: Use the date picker to select the reporting period.
Once your filters are set, click the Generate button to create the report.
Report Overview & Key Metrics
The generated report provides a high-level overview of campaign performance, including the following metrics:
- Impressions: Total impressions generated by the campaigns.
- Budget: Total budget spent within the selected period.
- Plays: Total number of ad play-outs achieved.
- Play Time: Sum of all play durations across campaigns.
- Winning Bids: Number of bids that won in auctions.
Charts: Ad Requests vs. Impressions
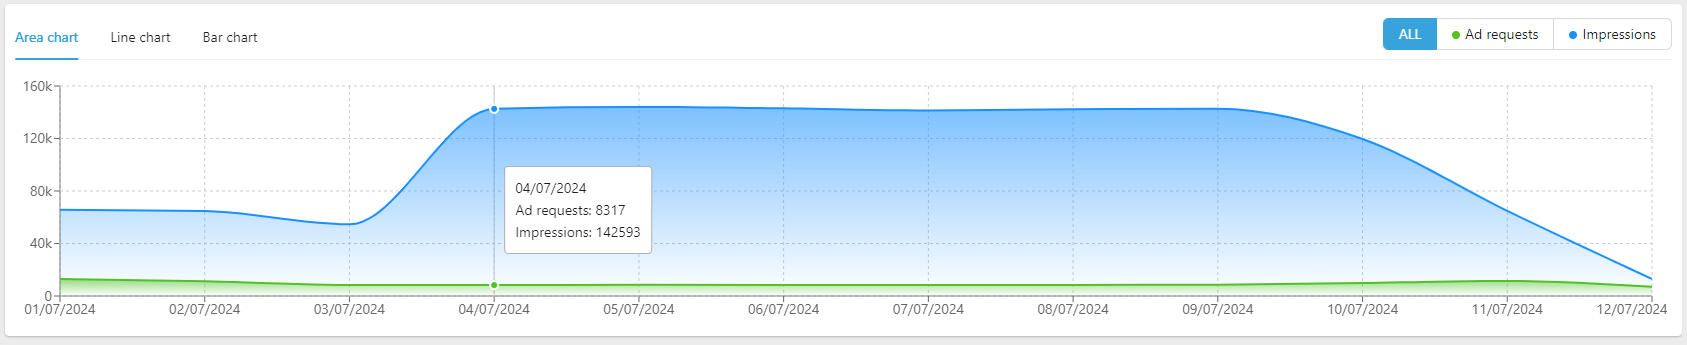
Campaign Reporting includes a chart comparing Ad Requests vs. Impressions. You can customize the display with the following chart types:
- Area Chart (default)
- Line Chart
Bar Chart
You can also focus on individual metrics, such as Ad Requests only or Impressions only.
Player-by-Player Breakdown
This section provides detailed performance metrics for each player in the selected campaigns. Each player is identified by Name and Network.
Metrics include:
- Ad Requests: Total requests sent from the player to the Ad Server / MadX.
- Deal Requests: Total deal-based requests generated by the player for the selected campaigns.
- Bid Requests: Total bid requests sent from MadX to DSPs as part of the auction.
- Bid Responses: Total responses received from DSPs.
- Winning Bids: Bids that won the auction and were approved for delivery.
- Winning Rate: Percentage of winning bids relative to total bid requests.
- Occupancy: Percentage of overall campaign play time filled by the player in the selected date range.
- Plays: Total successful ad play-outs from winning bids.
- Screen Playouts: Plays divided by the number of screens, indicating average delivery per screen.
- Play Rate: Percentage of successful plays relative to winning bids.
- Impressions: Total impressions generated from plays, considering player, network, or campaign multipliers.
- CPM (Cost per Mille): Cost per one thousand impressions.
- Revenue: Total revenue from impressions, calculated as:
Impressions × CPM / 1000
CSV Export
You can export the player-by-player breakdown or the entire campaign report as a CSV file using the Export Table button.
This allows for external analysis, reporting, or auditing, enhancing accessibility and operational efficiency.
Comments
0 comments
Please sign in to leave a comment.