Overview
Insights is designed for high-level analysis, trend monitoring, and financial oversight. Unlike Inventory and Campaign Reporting, Insights allows you to generate reports for a selected period with a daily breakdown, making it ideal for day-by-day performance tracking. It enables users to analyze daily revenue trends, DSP spend, eCPM fluctuations, geographic performance, and peak activity times, supporting strategic decisions, finance reconciliation, and executive reporting.
Use Insights to analyze daily performance trends and aggregated business results over time.
How-To Documentation (User Guide)
The Insights dashboard provides a complete overview of your network’s revenue, spend, and performance analytics.
This guide explains each part of the page and includes a dedicated chapter describing how the Export feature works.
1. Navigation & Filters
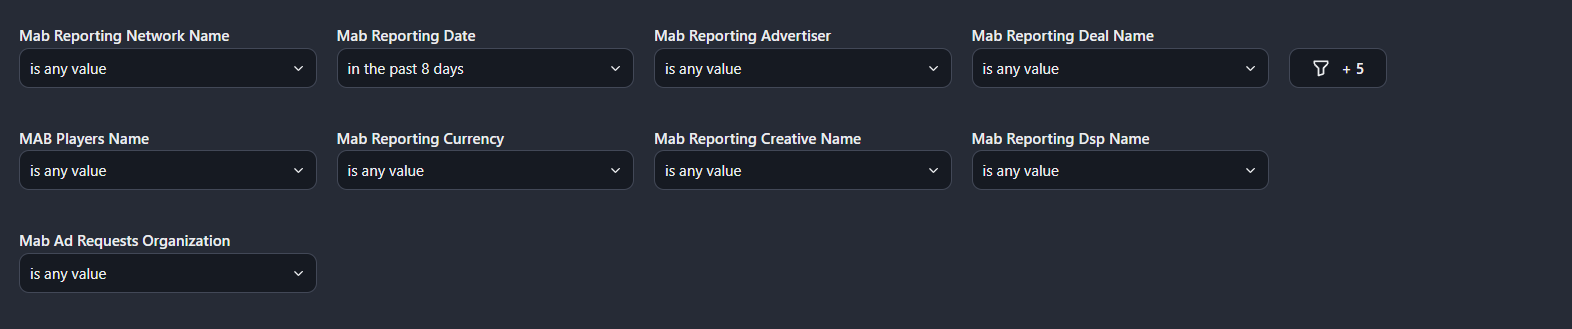
At the top of the page you can filter all visualisations and tables:
- Network Name
- Reporting Date
- Advertiser
- Deal Name
- Player Name
- Reporting Currency
- Currency
- Date Range
- etc.
All tiles automatically update when filters are applied.
2. Dashboard Components
2.1 Revenue Graph
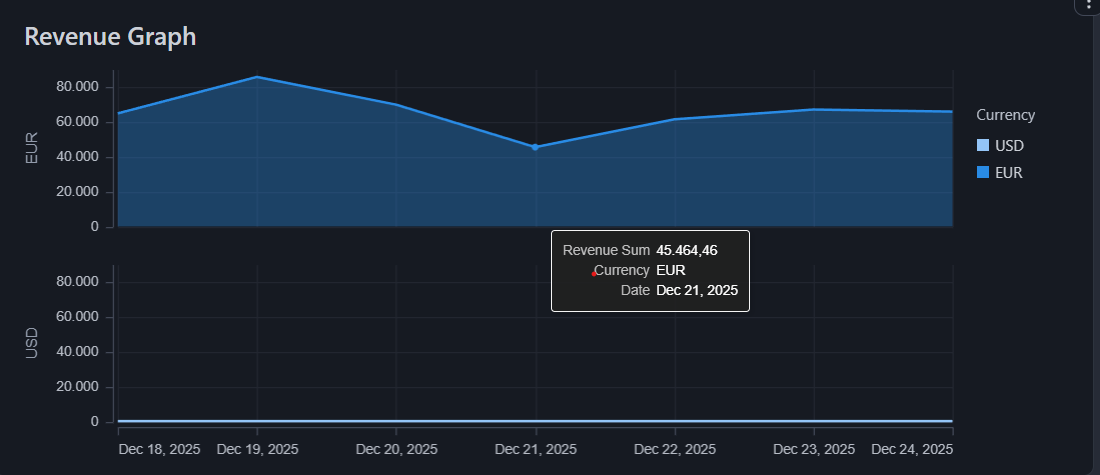
- Shows daily revenue over the selected date range.
- Use it for trend analysis and day-by-day performance comparison.
2.2 Revenue Summary
- A compact numeric overview of total revenue for the selected period and currency.
2.3 DSP Spend (Table)
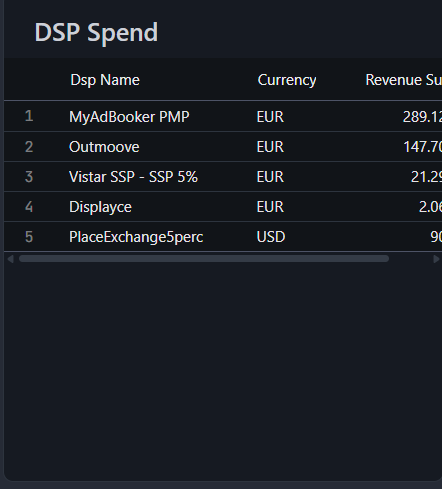
Shows DSP-level spend grouped by:
- DSP Name
- Currency
- Revenue Sum
Useful for reconciliation and comparing DSP contributions.
2.4 DSP Spend Graph
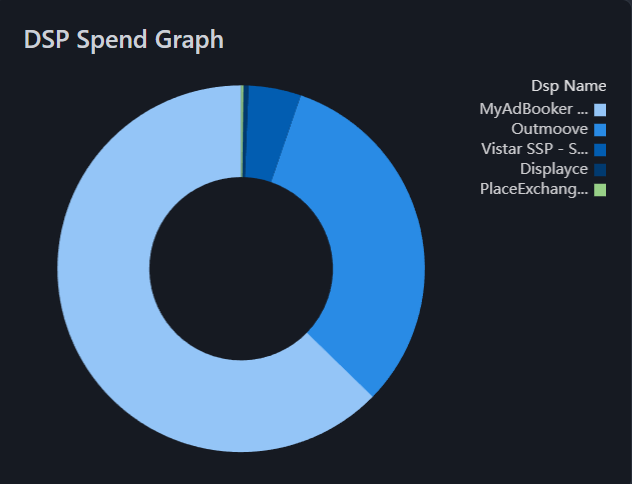
- A donut-chart breakdown of total DSP spend, ideal for visual share-of-wallet insights.
2.5 DSP eCPM
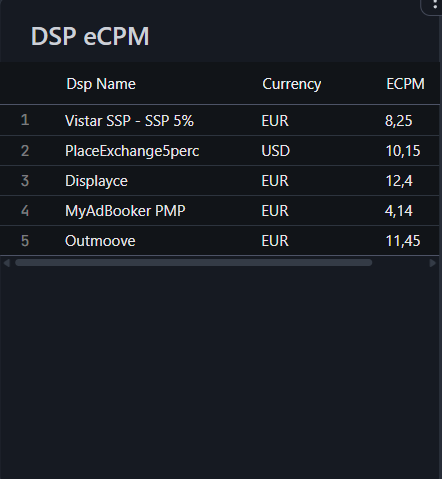
A table containing:
- DSP
- Currency
- Impressions
- Spend
- eCPM values
Used for billing validation, performance comparison, and DSP benchmarking.
2.6 Map View
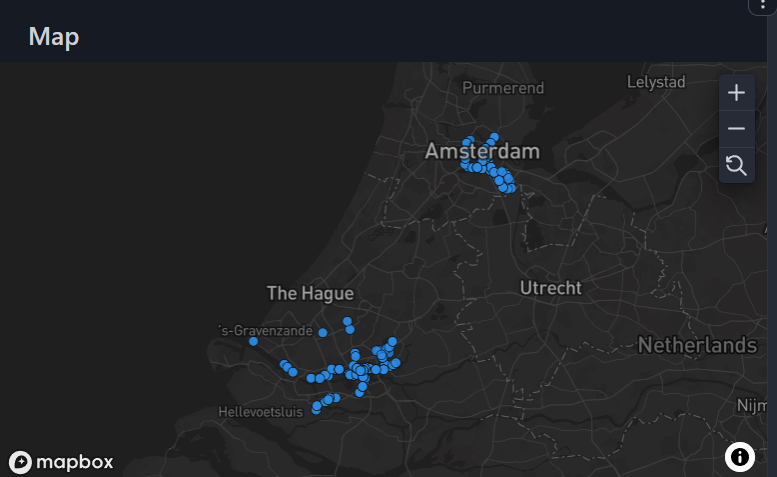
- Displays where impressions or revenue originate geographically.
- Helps identify strong regions and screen clusters.
2.7 Popular Times
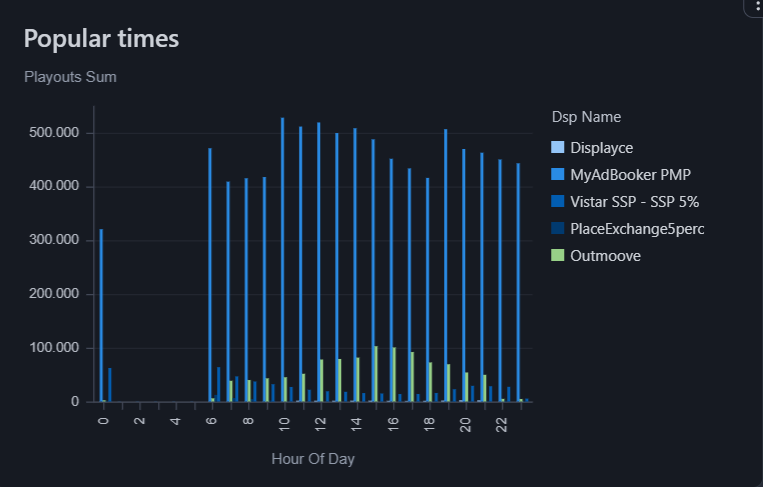
- A bar chart showing activity peaks across different hours of the day.
- Used to analyse pacing, traffic waves, and network pressure.
3. Export Feature (All Tiles)
Every tile on the Insights page includes the same export mechanism, which works consistently across graphs, tables, and maps.
3.1 How to Export Any Tile

- Move your mouse over the top-right corner of the tile.
- Click the three-dot menu (ellipsis ⋯).
- Choose the export option you want:
- Download CSV / Excel / JSON (tables)
- Download Image (PNG) (graphs & maps)
- Download Data (raw numerical dataset where applicable)
3.2 What Gets Exported
Exports always respect:
- Active filters (date, DSP, player, advertiser, etc.)
- Selected currency
- Visible aggregated values
3.3 Recommended Uses
- Finance teams can export DSP eCPM for billing.
- Sales & reporting teams export Revenue Graph and DSP Spend for client reporting.
- Operations teams export Map View and Popular Times for network performance evaluation.
4. Best Practices
- Apply filters before exporting for cleaner datasets
- Use exports regularly for DSP audits and reconciliation.
- Export the DSP tables around month-end for Finance workflows.
- Use the image exports for presentations, campaign summaries, or updates to network partners.
Comments
0 comments
Please sign in to leave a comment.