Overview
Inventory Reporting should be used when the focus is on supply-side performance and inventory health. It provides aggregated totals for a selected period, such as the total number of ad requests, impressions, plays, occupancy, and revenue.
This reporting is ideal for operational and technical analysis, helping teams identify underperforming players, troubleshoot delivery issues, and understand how inventory is filled over a given time range.
Use Inventory Reporting to analyze total inventory performance and health over a selected period.
Accessing Inventory Reports
- Navigation: You can access the Inventory Reporting page via the Reporting menu in the application interface.
Configuring Your Report
- General Information Bar: Located at the top of the Inventory Reporting page, this bar includes the following filters:
- Networks: Dropdown selection to filter reports by network.
- Players: Dropdown selection to filter reports by specific players.
- Sites: Dropdown selection to filter reports by site (player’s location).
- DSPs: Dropdown selection to filter reports by DSP/s.
- Time Range: Date picker to select the reporting period.
Generate Button: After selecting the desired criteria, users click the "Generate" button to create the report.
Report Overview & Key Metrics
The generated report will display the following key performance indicators (KPIs):
- Ad Requests: Total number of requests sent from the player to the Ad Server/MadX.
- Bid Requests: Requests sent to DSPs during the auction process.
- Bid Responses: Responses received from DSPs to the bid requests.
- Winning Bids: Total number of bids selected as winners in the auction.
- Occupancy: The ratio of winning bids to ad requests, showing how much of your inventory is filled
- Plays: The number of successful ad play-outs resulting from winning bids..
- Play Rate: Percentage of plays compared to winning bids.
- Impressions: Total views calculated from plays x multipliers (player, network, seasonality).
- Revenue: Earnings generated from impressions, calculated using the formula: Impressions × CPM / 1000.
Note:
- One ad request can trigger multiple bid requests if multiple DSPs are involved
- The AdExchange accepts only one response per DSP
- Only one DSP can win per auction, so winning bids are always equal to or fewer than bid responses
Ranking Tables
The report includes two ranking tables:
- Revenue Ranking Table: Ranks players based on total revenue generated.
- Ad Request Ranking Table: Ranks players by the volume of Ad Requests.
This overview helps you identify which players are top-performers and which are receiving the most traffic.
Funnel Visualization
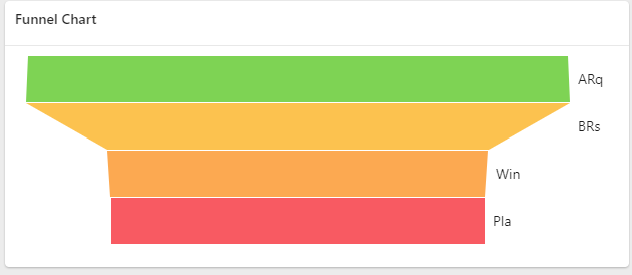
The funnel chart illustrates the complete ad-delivery process, tracking the flow from initial ad requests through to playouts.
- Ad Requests
- Bid Requests
- Bid Responses
- Winning Bids
- Playouts
This visualization helps highlight areas where attention might be needed.
Request Activity
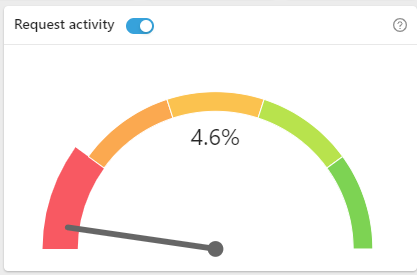
This section displays the percentage of active players that are sending Ad Requests.
- Target value should be 100%.
- Any active players not submitting requests should be reviewed.
Charts: Ad Requests vs. Impressions
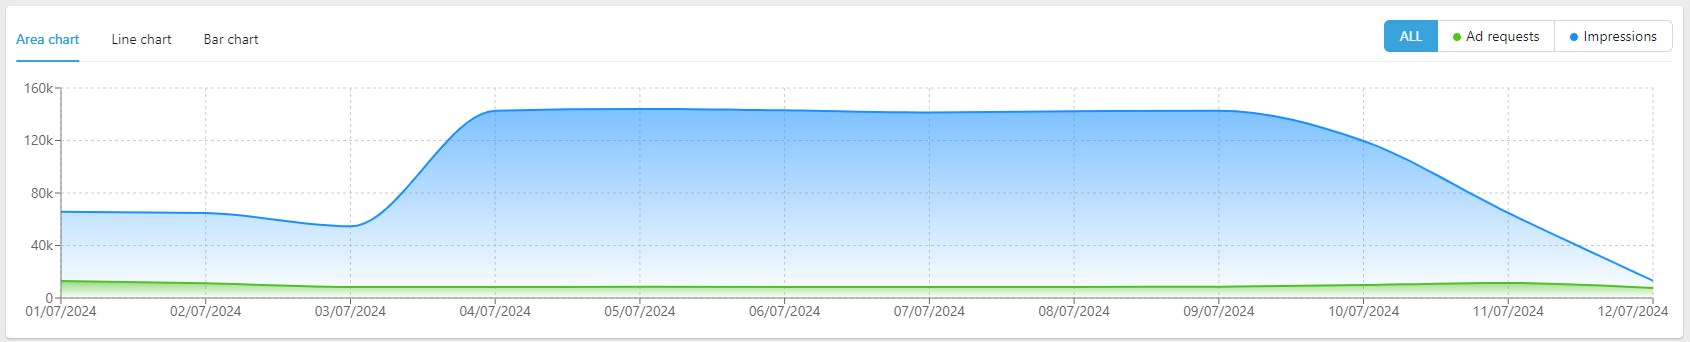
You can visually compare Ad Requests and Impressions over time. The chart options include:
- Area Chart (default)
- Line Chart
- Bar Chart
*You can customize to focus on individual metrics (Ad Requests only or Impressions only)
Player-by-Player Breakdown
This section provides detailed performance metrics for each player individually.
CSV Export
You have option to export player-by-player breakdown in CSV format using the Export Table button.
This enables you to perform external analysis, reporting, audits, or support investigations, improving both accessibility and operational efficiency.
Comments
0 comments
Please sign in to leave a comment.